
Communicating effectively with clients and stakeholders is the only means to successfully manage expectations. Well managed expectations are the difference between building client and stakeholder relationships based on trust or always struggling to maintain some semblance of believability. In essence, you do what you say you are going to do when you say you are going to do it. Well managed expectations also create an operating environment that is more predictable and contains less stress for team members.
Because it can be such a challenge to keep expected and actual production capabilities aligned, one of the most basic things any manager can do is create a baseline or benchmark for team performance. This is basically nothing more than determining how much of what actions a team can perform within a specific timeframe. These actions can be anything from sales calls to data entry tasks to ledger entries.
To do that, of course, you must be able to identify and apply weightings to any variable that could have a material impact on overall throughput or production rates. As mentioned elsewhere, these variables can include basic items such as scheduled vacations days of team members, to less predictable things, such as a shift in delivery dates.
Anything that can impact a team’s operating environment has the potential to either positively or negatively change the overall productivity of the team. In some instances, just completing more of one task might result in an increase in future maintenance related tasks which in turn will reduce the ability to produce more of the first task in the future. The rate of reduction in productivity in this case is a type of diminishing return. In order to maintain production levels, the manager must be able to adjust such as articulating the need for additional resources. When an operating environment is dynamic it can be challenging to maintain and manage client and stakeholder expectations.
Even in a steady state, most operating environments experience “contracting” events. These events are things that impact team productivity overall. Some of these events are not events at all but rather ordinary conditions. In an example where there is a production team consisting of ten people who each produce 10 widgets per hour, a manager could simply assume that with 160 working hours per month, this team should be able to produce a total of 16,000 widgets per month, on average (10 people x 10 widgets per hour x 160 hours in a month).
However, that math is flawed for a couple of reasons. First, there are basic requirements of these team members. Maybe they need to take an hour lunch and two breaks of 15 minutes per day. That would erode productivity by 1.5 hours per day per staff member. So total production would be reduced to 13,000 widgets per month. What if there was at least one weekly staff meeting with a one-hour duration. That would further erode production by 10 man-hours per week, or 40 hours total in a month. So actual output would be lowered to only 9,000 widgets per month. Then if you factor in vacation days allowed, holidays, etc. productivity will be further eroded. The point is that the real capacity of a team is somewhat lower than the perceived production capacity because of the impact of ordinary operating conditions.
Extraordinary conditions, or contracting events, can also impact team productivity and capacity in a variety of ways. A contracting event can be a one-off event, such as an act of God resulting in the temporary closure of a facility, or a more regularly impacting event, such as the addition of project work into the production work queue. The office closure is tough to plan for but its impact on productivity will be easy to measure. The introduction of project work into the production work queue is more complicated. Each project, whether internally generated or client directed, will have a different scope, require different resources and different delivery times, etc. As such, developing a predictive model to measure the impact of these events can be challenging.
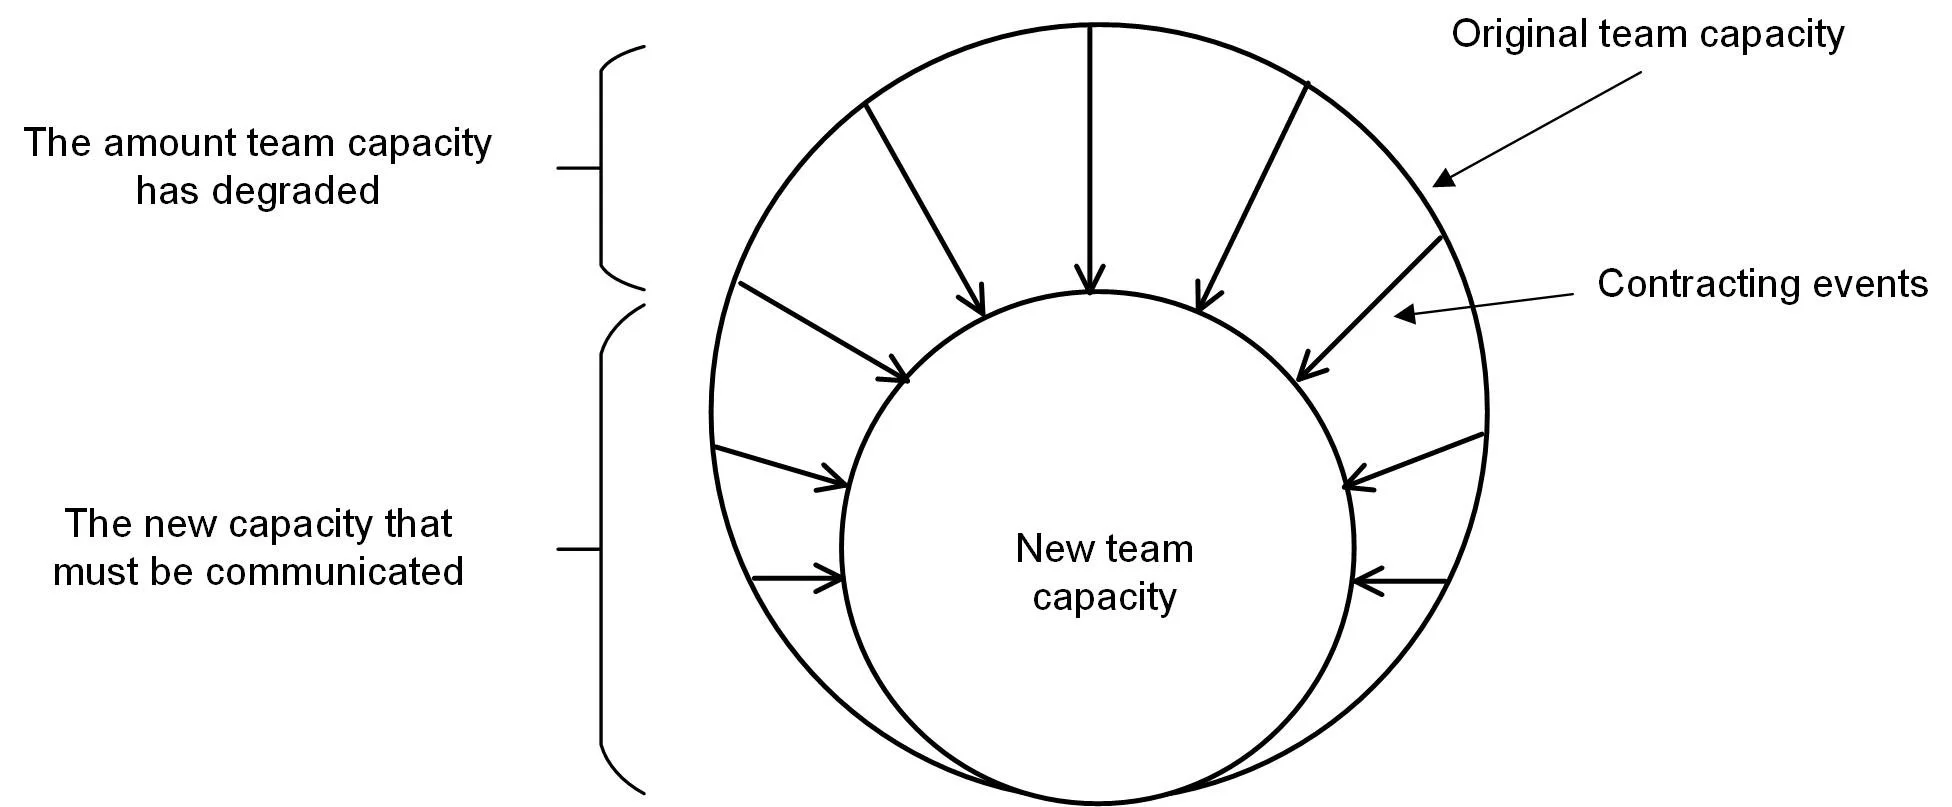
Establishing a baseline for “normal” capacity of a team will allow the manager to communicate effectively to clients and stakeholders as conditions change. In our above example, the manager of that team will start with the total possible production rate based on total headcount, number of working hours and average productivity per staff member. She will then reduce this capacity by an amount equal to the variables in the ordinary day that can restrict productivity. She will then add back production where applicable, such as in the case of pre-approved overtime. This will be the baseline that she will use to communicate capacity to her clients and stakeholders. As extraordinary contracting events occur, these changes in capacity will need to be communicated.
She should also be predictive in her thinking. For example, a good manager will report risks to productivity as well. These are the classic “if/then” conditional scenarios where “if this thing happens then productivity will erode/expand by X percent”. Smart managers will find a way to depict a baseline rate of production as compared to the current production rates as a means to help manage stakeholder expectations on an ongoing basis.
The baseline rate of production can almost always be depicted as a predictable amount of work (i.e. a unit of work) that can be produced over a specified period of time. That rate of production, or the total available capacity of a team, once normalized for ordinary operating conditions is your baseline production rate. As variables change over time, the production rate will change over time. Although managers may be able to tweak production rates temporarily through overtime, adding staff, various incentives etc., these increased rates are normally not sustainable.
In the below example, the operations manager has a normalized capacity of 1,000 units of work in 10 weeks where normalized capacity equals the total possible production rate less the impact of ordinary operating conditions. In weeks one through four the team’s production rate is falling short of expectations for some unknown reason. The manager can see clearly that if the current production rate in week four is extended to the end of the timeline the target of 1,000 units would be missed by around 350 units. In week five the manager made an adjustment and the rate of production increased dramatically. That adjustment might have taken the form of approving additional overtime, adding or reassigning resources to the effort or simply putting some other initiative down temporarily. By the beginning of week six the project is back on track.
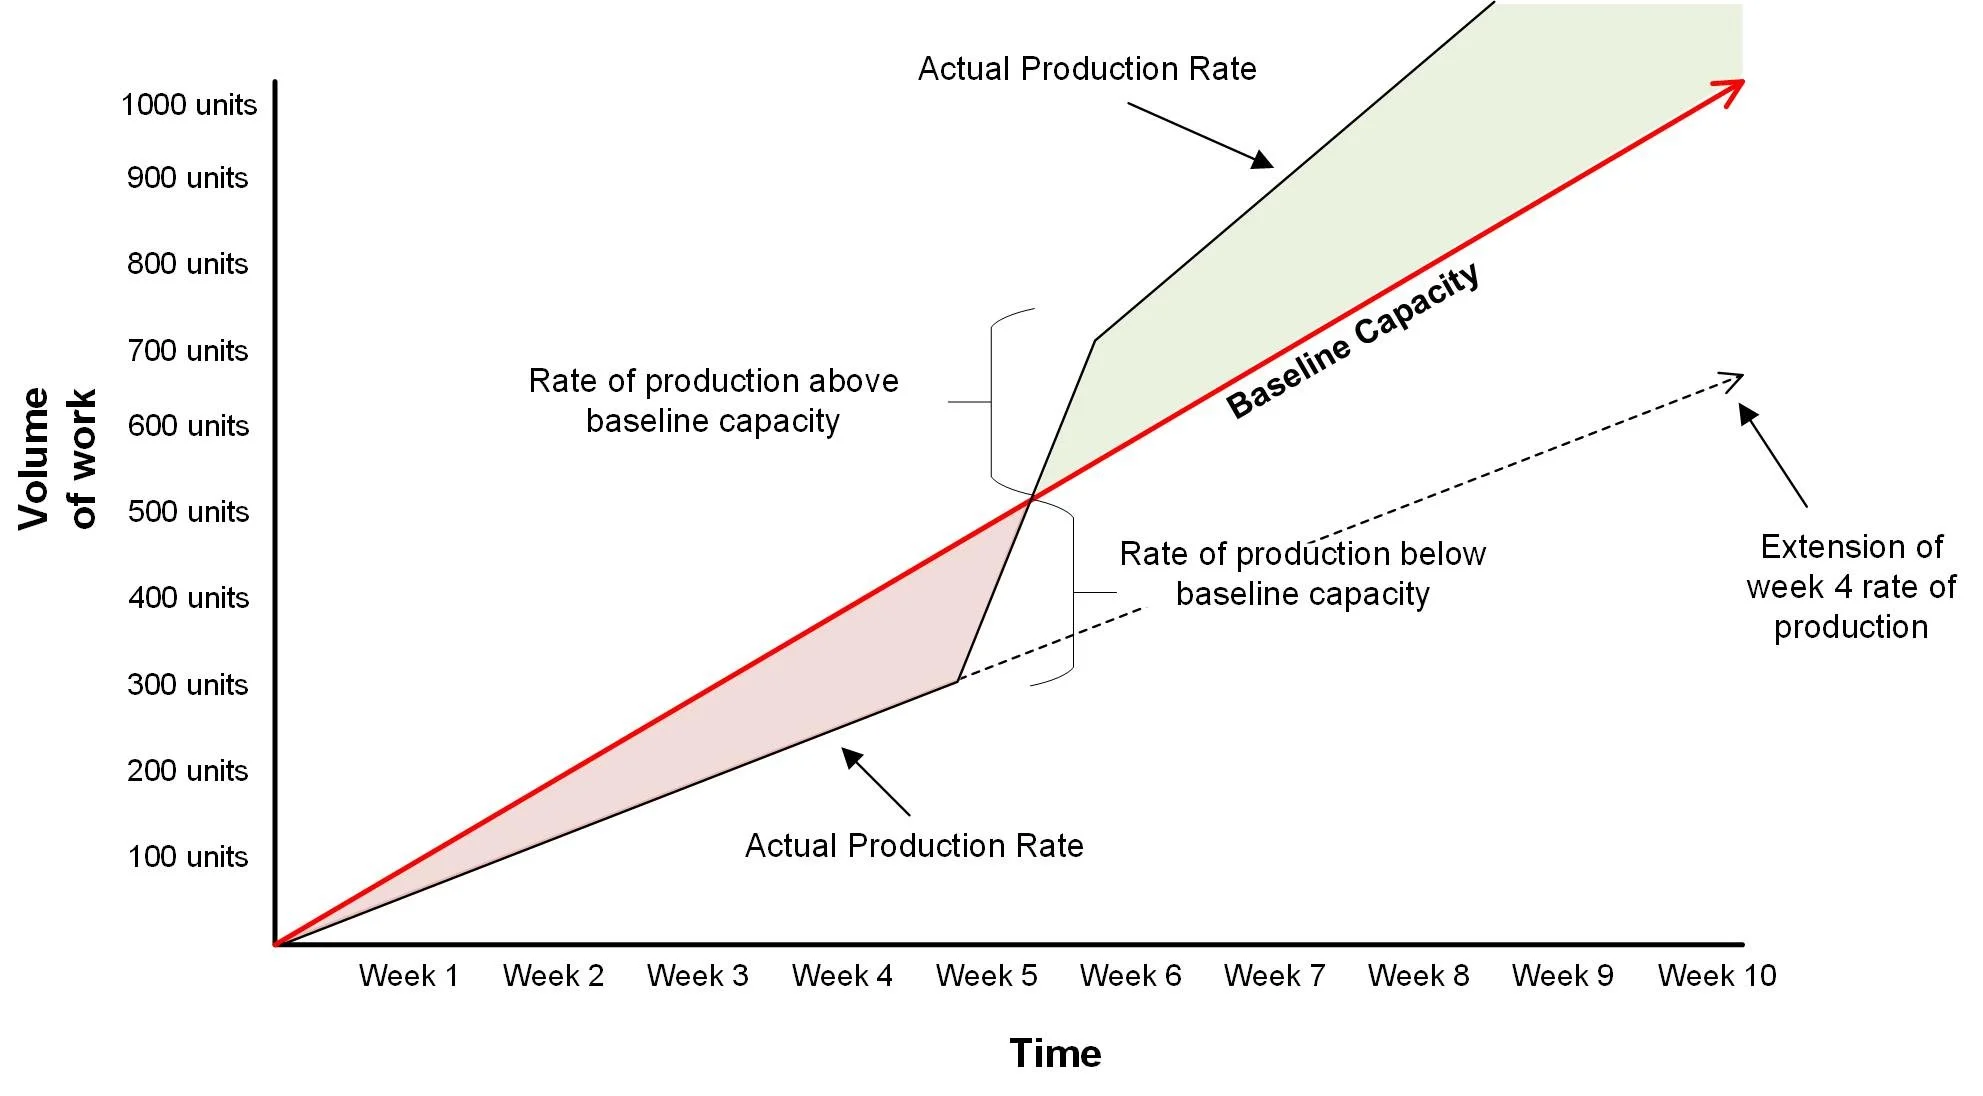
In fact, if the operations manager makes no additional changes after the adjustment in week five the rate of production will begin to exceed expectations. The operating variables that resulted in increased production rates can either be maintained or further downward adjustments made as necessary to maintain a sustainable rate of production. Either way, a means to report current production against baseline capacity or a predictive model showing future production based on operating variables as compared to baseline capacity can be a valuable tool in managing client and stakeholder expectations.
While it might not seem intuitive, this type of modeling can be applied to nearly all functions of a business and not just pure production operations. For example, a sales team has a defined capacity to call on leads generated by the marketing program within a specified timeframe. Sales leadership will define success criteria differently than a production manager, but from a capacity management and resource utilization perspective the exercise is the same. The production manager will be looking for units per month produced and the sales manager will be looking for meetings generated from calls made. Different units of work to be sure but the same tools can be leveraged to manage progress and reporting.
All managers regardless of their functional focus should do the following to help manage expectations:
1. Define a unit of work for a team. Some teams will have several types of units of work based on their job functions.
2. Calculate the total possible capacity of a team to produce a set number of units of work within a specified timeframe.
3. Normalize the total possible capacity by subtracting negative ordinary operating variables and adding levers to offset the negatives (i.e. approved overtime).
4. Complete an analysis of active extraordinary contracting events, or things that are impacting production rates today.
5. Identify inactive extraordinary contracting events, or things that could impact future production rates.
6. Develop a predictive model that graphically depicts current production as compared to baseline capacity.
7. Socialize with stakeholders as appropriate.
These steps are all designed to help establish a benchmark or baseline rate of production so that you can more effectively manage stakeholder expectations in perpetuity based on actual production capacity.
One key activity that will make this type of graphic more valuable is to take the time to define each key term to ensure a common vocabulary. For example, in the above example one could define “baseline capacity” as being equal to a production rate of 100 units per week less the impact of average absentee rates and other ordinary events. Any regular reporting to management or stakeholders would contain that information plus a description of any extraordinary event or project impacting production and a prediction of the future rates based on known variables. If there is no common vocabulary between the person reporting and the person reading the report then there should be no expectations that the report will be well received, despite all the best efforts.
For more information about this article or our services, reach out to us at info@coeurderoy.com.